Smart meters in the US by the numbers, 2007 to 2025
US electric utilities had 147.1 million smart meters at the end of 2025, according to federal data released in October 2026. That's 86.6% of all electric meters and 86.9% of residential ones, up from 38.8% of residential meters in 2013. The holdouts are clustered in a few places: in Massachusetts, Connecticut and New Hampshire, fewer than 22% of residential meters were smart meters.
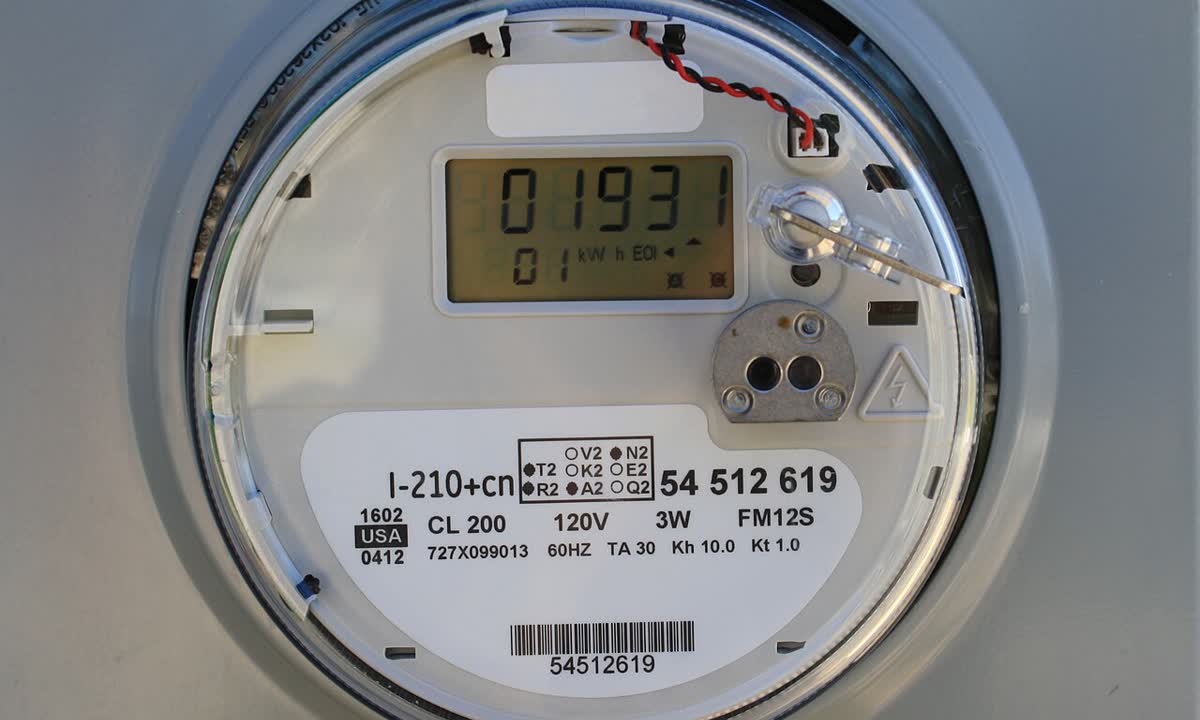
Every figure here comes from the Energy Information Administration. Where we did the adding or dividing ourselves, we say so.
Where the count comes from
Each year, distribution utilities report their meters to EIA on Form EIA-861, sorted into three kinds. The survey's instructions define them this way:
- Advanced metering infrastructure (AMI), the smart meter, records use at least hourly and sends it to the utility at least daily.
- Automated meter reading (AMR) collects data "for billing purposes only" and sends it one way, sometimes to a van driving past.
- Standard meters are read by hand over a monthly billing cycle.
EIA publishes the national totals in Table 10.5 of the Electric Power Annual, whose 2025 edition came out on October 21, 2026. Years before 2016 are in the 2016 edition's Table 10.10, which matches the newer table where the two overlap.
Two quirks in the footnotes matter for the chart below. Before 2010, EIA counted customers rather than meters. Standard meters weren't reported at all until 2013.
You may also come across EIA's FAQ on smart meters. It gives about 119 million for 2022 and hasn't been updated since October 2023. The table has three newer years.
Smart meters by year
Counts before 2010 are customers, not meters. Standard meters were first reported in 2013.
Show the numbers
| Year | Smart meters (AMI) | Automated reading (AMR) | Standard meters |
|---|---|---|---|
| 2007 | 2.5million | 28.2million | |
| 2008 | 4.6million | 40million | |
| 2009 | 9.6million | 45.8million | |
| 2010 | 20.3million | 48.7million | |
| 2011 | 37.3million | 46million | |
| 2012 | 43.2million | 48.3million | |
| 2013 | 53.3million | 47.3million | 37.4million |
| 2014 | 58.5million | 46.8million | 38.9million |
| 2015 | 64.7million | 47.6million | 38.5million |
| 2016 | 70.8million | 46.8million | 33.7million |
| 2017 | 78.9million | 44.4million | 28.8million |
| 2018 | 86.8million | 41.2million | 26.1million |
| 2019 | 94.8million | 37.1million | 24.7million |
| 2020 | 102.9million | 33.3million | 22.7million |
| 2021 | 111.2million | 29.8million | 20.9million |
| 2022 | 118.7million | 26.6million | 18.7million |
| 2023 | 127.8million | 22.7million | 15.7million |
| 2024 | 140.5million | 19.3million | 8.3million |
| 2025 | 147.1million | 16.2million | 6.5million |
Source: EIA Electric Power Annual, Table 10.5 (2025 edition) and Table 10.10 (2016 edition), rounded by Meter on the Wall.
The line has two steep stretches. Between 2009 and 2011 the count went from 9.6 million to 37.3 million, an increase of 27.7 million in two years. Then 2024 added 12.7 million, the biggest one-year jump since 2011. In that same year, standard meters fell from 15.7 million to 8.3 million.
The table doesn't explain the 2024 jump, and we won't guess. The arithmetic is simple enough, though. Smart meters rose by 12.7 million, standard meters fell by 7.4 million and AMR meters by 3.5 million, while the total number of meters grew by about 1.9 million.
AMR meters, the kind sometimes read from a passing van, peaked in 2010 at 48.7 million and have dropped every year since 2015. By 2025 the two older types together came to about 22.7 million meters, against 147.1 million smart ones.
How much of it is homes
Homes account for most of the smart meters, and for most of the meters, period. In 2025, 128.8 million of the 147.1 million AMI meters were residential, or 87.5% by our division. That share has barely moved in a decade. Coverage grew much faster, as the shares below show (again our division of EIA's counts).
| Year | Smart meters, all customers | Share of all meters | Share of residential meters |
|---|---|---|---|
| 2013 | 53.3 million | 38.6% | 38.8% |
| 2015 | 64.7 million | 42.9% | 43.3% |
| 2017 | 78.9 million | 51.9% | 52.2% |
| 2019 | 94.8 million | 60.5% | 60.9% |
| 2021 | 111.2 million | 68.7% | 69.1% |
| 2022 | 118.7 million | 72.3% | 72.8% |
| 2023 | 127.8 million | 76.9% | 77.4% |
| 2024 | 140.5 million | 83.6% | 83.9% |
| 2025 | 147.1 million | 86.6% | 86.9% |
The 2022 row lines up with the FAQ's "about 73%" for homes, which is a useful check on the arithmetic.
State by state
For states, we summed the utility-level rows in EIA's 2025 Form EIA-861 data files, released October 7, 2026. One detail: the file includes rows marked "Behind the Meter," which add about 1.1 million AMI meters that aren't in the national table. We left them out, and our national sums then match Table 10.5 to the meter.
| State | Residential smart meters | All residential meters | Smart meter share |
|---|---|---|---|
| District of Columbia | 333,557 | 334,523 | 99.7% |
| Maine | 754,162 | 765,022 | 98.6% |
| Pennsylvania | 5,579,283 | 5,696,191 | 97.9% |
| Colorado | 2,589,967 | 2,652,759 | 97.6% |
| Michigan | 4,741,993 | 4,878,450 | 97.2% |
| Texas | 12,793,313 | 13,275,488 | 96.4% |
| Florida | 10,457,607 | 10,868,019 | 96.2% |
| California | 12,847,719 | 14,703,768 | 87.4% |
| New York | 6,480,879 | 7,563,362 | 85.7% |
| New Mexico | 355,792 | 978,457 | 36.4% |
| Nebraska | 303,166 | 923,430 | 32.8% |
| New Hampshire | 150,673 | 699,629 | 21.5% |
| Connecticut | 338,919 | 1,613,809 | 21.0% |
| Massachusetts | 634,740 | 3,190,728 | 19.9% |
Twenty-five states plus DC were at or above 90%. Just above the bottom five were Rhode Island at 39.6% and Wyoming at 40.4%.
Grouped by utility, the largest fleets belong to Florida Power & Light with 6.2 million AMI meters, then PG&E with 5.8 million, Southern California Edison with 5.6 million, Commonwealth Edison in Illinois with 4.4 million and Oncor in Texas with 4.1 million.
What else the survey counts
The same file asks two questions that say something about how the meters get used. Utilities reported 12.4 million residential AMI meters with a home area network gateway turned on, the part of the meter that lets it talk to devices inside the house. And 65.1 million residential customers could see their daily use online or through some other electronic channel. Both are our sums of the 2025 file, with the behind-the-meter rows dropped.
How to look up your own utility
The state table above is a sum. Your utility's own row is in the same public file, and it takes a few minutes to find.
- On EIA's Form EIA-861 page, download the 2025 ZIP file. Ours was about 4.8 MB.
- Open the file named Advanced_Meters_2025. The sheet called "states" has one row per utility per state.
- Find your utility by name and state. The columns come in groups (AMR, AMI, home area network, standard and total), each split into residential, commercial, industrial and transportation.
- Divide the residential AMI count by the residential total to get your utility's smart meter share.
- Treat a dot as "not reported," not as zero. Some utilities file EIA's short form, and EIA says standard-meter counts aren't collected on it.
What the numbers don't tell you
Before you quote the survey, keep its limits in mind.
- It counts electric meters only. Gas and water meters aren't in it.
- It has no opt-out column, so it can't tell you how many households turned a smart meter down.
- The AMI definition is about what the meter records and how often it reports, not how. The survey doesn't say how many meters use radio.
- It counts meters, not people or households. A house with two electric meters counts twice.
None of these tables follows what people do about the meter on their own house, either. Some opt out, and our fee comparison shows what that costs. Some buy products from the category stores call EMF protection stickers. EMFCALM, for example, sells multi-device sticker packs for phones, tablets, laptops and routers. EIA doesn't count any of that, and we don't evaluate the products.
If you live in Massachusetts, Connecticut or New Hampshire, the meter on your wall in 2025 was more likely an older type than a smart one. In all three, roughly four in five residential meters were something other than AMI.