How much radio energy a smart meter gives off, and how often
A smart meter's radio is weak and silent nearly all day. In the figures California's science advisers relied on, one meter 3 feet away came to between 0.016% and 0.3% of the FCC's general-public limit once its on-and-off pattern was averaged in. In one utility's data, 999 meters in 1,000 were on the air for less than 15 minutes a day.
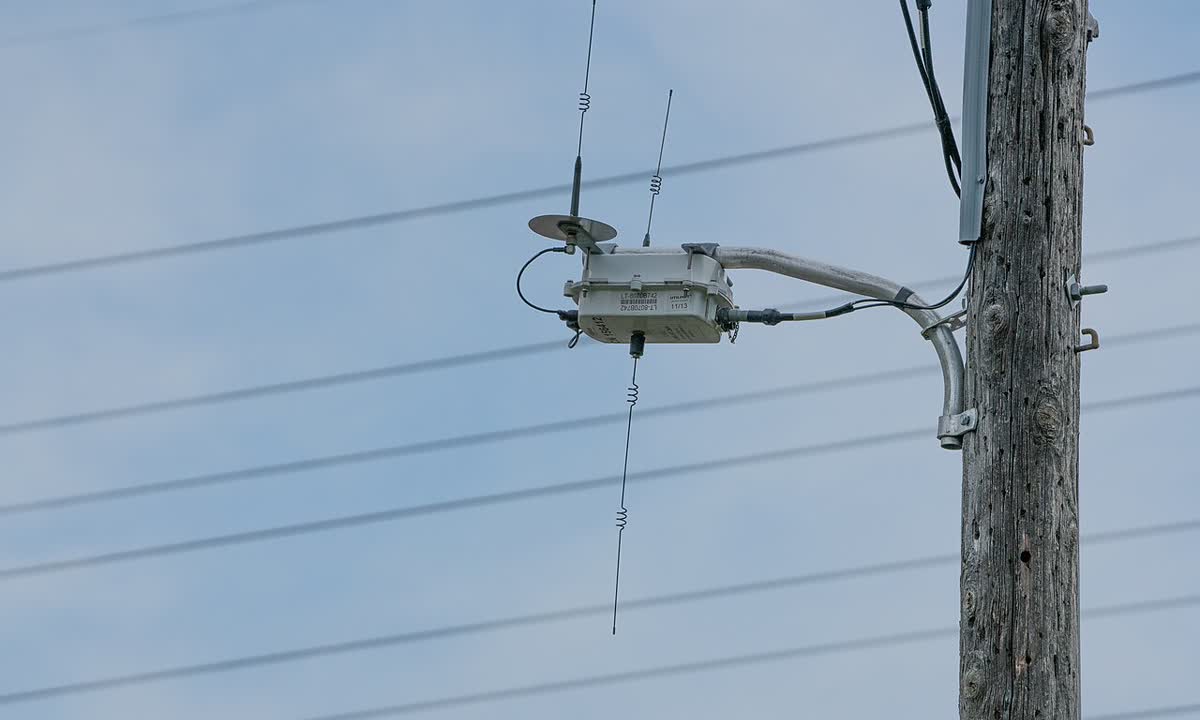
Those figures come from three documents written in 2011, while California was arguing over its rollout. They're still the most detailed public numbers we could find. Below is what they say and what they leave out, with our own arithmetic marked as ours.
What the FCC limit is at a meter's frequencies
The federal limit for the general public is in 47 CFR 1.1310. For frequencies between 300 and 1,500 MHz, the maximum power density is the frequency in MHz divided by 1,500, in milliwatts per square centimeter. The electric meters in these documents talk to the utility at 902 to 928 MHz, so the limit works out to about 0.60 to 0.62 mW/cm², or 600 to 620 microwatts per square centimeter (µW/cm²). Some meters also have a 2.4 GHz radio for devices inside the home, and above 1,500 MHz the limit is 1.0 mW/cm², or 1,000 µW/cm².
Two details in the rule matter here. The limit is averaged over 30 minutes for the general public. And the rule says levels "higher than the limits are permitted for shorter exposure times," as long as the average over that window stays under the limit. A meter that transmits in short bursts is judged on its average, which is why duty cycle, the share of time a device is actually transmitting, comes up in every document below.
How often a meter transmits
A meter on a mesh network sends a lot of tiny messages, many of them relayed for neighboring meters. In a November 2011 filing with the California PUC, PG&E listed its scheduled messages by type. They add up to about 9,981 transmissions on an average day (our sum), and 9,600 of them are mesh-network messages. Added together, they were short.
| Source | Which meters | Time on the air per day | Share of the day |
|---|---|---|---|
| PG&E filing, 2011 | Median meter in an 88,000-meter vendor study | About 45 seconds | 0.05% |
| PG&E filing, 2011 | Mean of the same study | About 62 seconds | 0.07% |
| PG&E filing, 2011 | 99.9th percentile | 875 seconds | About 1% |
| EPRI case study, 2011 | 99.5% of about 47,000 meters in southern California | 3 minutes 10 seconds or less | 0.22% or less |
| EPRI case study, 2011 | The busiest meter in that sample | 72 minutes or less | 5% or less |
| CCST report, 2011 | A hypothetical future meter that sends half the time | 12 hours | 50% |
The PG&E percentages are our division of seconds by the 86,400 seconds in a day. PG&E's gas meter modules averaged 0.676 seconds a day. The PG&E figures came from its meter vendors and describe networks as they ran in 2011. New features could add transmit time, and the California Council on Science and Technology said so when it built its 50% case.
How strong the signal is at 3 and 10 feet
The Electric Power Research Institute is a nonprofit whose members, by its own count, generate and deliver more than 90% of US electricity. It measured one meter model at the manufacturer's test site. Its February 2011 case study estimates time-averaged power density for a single meter in the direction where the signal is strongest. It also says how to get the level during a transmission: multiply the 1% values by 100 and the 5% values by 20. We did that in the fourth column.
| Distance | Meter setup in EPRI's table | Averaged over time (µW/cm²) | During a transmission (µW/cm², our calculation) | FCC limit near 900 MHz (µW/cm²) |
|---|---|---|---|---|
| 3 feet | 250 mW radio, 1% duty cycle | 0.1 | 10 | About 600 |
| 3 feet | 1 W radio, 5% duty cycle | 2 | 40 | About 600 |
| 10 feet | 250 mW radio, 1% duty cycle | 0.009 | 0.9 | About 600 |
| 10 feet | 1 W radio, 5% duty cycle | 0.2 | 4 | About 600 |
Even the strongest burst in that table, 40 µW/cm² at 3 feet, works out to under 7% of the limit by our arithmetic. The averaged levels are far lower. EPRI's own text puts the 3-foot cases at about 0.3% and 0.016% of the limit, and the 10-foot cases at 0.03% and 0.0014%.
Distance does most of the work. For a single meter, power density falls with the square of the distance, so doubling the distance cuts it to a quarter. The CCST report's worked example runs 8.8 µW/cm² at 1 foot, 1.0 at 3 feet and 0.1 at 10 feet. PG&E's filing calculated a 30-minute average of 0.35 µW/cm² at 20 centimeters, about 8 inches, from its 1-watt meter radio, using duty cycles from field data. That's 0.058% of the limit.
Values as published by each source. Most bars are too short to see at this scale, which is the point of drawing them against the limit.
| Scenario | Share of the FCC limit |
|---|---|
| CCST hypothetical, one meter at 50% duty, 1 ft | 30% |
| EPRI measured, rack of 10 meters sending nonstop, 1 ft | about 8% |
| CCST typical with relaying, 5% duty, 1 ft | 3% |
| EPRI measured, 8 in behind the rack, nonstop | about 0.6% |
| EPRI estimate, 1 W meter at 5% duty, 3 ft | about 0.3% |
| PG&E, 30-minute average at 20 cm | 0.058% |
| EPRI measured, 8 in behind the rack, 5% duty | 0.03% |
| EPRI estimate, 1 W meter at 5% duty, 10 ft | 0.03% |
| EPRI estimate, 250 mW meter at 1% duty, 3 ft | 0.016% |
| EPRI estimate, 250 mW meter at 1% duty, 10 ft | 0.0014% |
Source: CCST 2011 report, EPRI case study 1022270 and PG&E's 2011 CPUC filing, all linked on this page. Dashed line: the FCC general-public limit, 100%.
The EPRI rack test is the closest to a worst case in these documents. Ten meters were programmed to transmit continuously, which deployed meters don't do, and the reading 1 foot in front was about 8% of the limit. By 50 feet the rack's signal could no longer be told apart from the background at the test site.
What about the other side of the wall
If a bed or a desk sits against the meter wall, this is the measurement that applies. EPRI took readings behind the meter rack to stand in for the far side of a wall. Eight inches behind the ten meters, exposure for nonstop transmission was about 0.6% of the FCC limit, and 0.03% at a 5% duty cycle.
EPRI also found that, in one sample, the field near a meter was concentrated between 3 and 6 feet above the floor, and the average across a body was less than a quarter of the peak. It warned that this single sample "should not be generalized."
How it compares with other things in a house
The same EPRI table lists other common sources. The numbers below are converted to µW/cm² from its milliwatt figures.
| Source | Distance | Level (µW/cm²) | When |
|---|---|---|---|
| Cell phone | At the ear | 1,000 to 5,000 | During a call |
| Microwave oven | 2 inches | About 5,000 | During use |
| Microwave oven | 2 feet | 50 to 200 | During use |
| Wi-Fi router | 3 feet | 0.2 to 1 | Constant when nearby |
| Cell tower | Tens to a few thousand feet | 0.005 to 2 | Constant |
| Radio and TV broadcast | Far from the source | 0.005 for half the population, 1 for the top 1% | Constant |
| Smart meter, 1 W at 5% duty | 3 feet | 2 | Time-averaged |
Treat the phone row with care. A phone's field is concentrated at the head, and the FCC judges phones by the energy absorbed in tissue, not by power density in the air. EPRI makes the same point, so the phone row is a rough reference, not a match for the meter row.
The National Cancer Institute's fact sheet on electromagnetic fields, last reviewed in May 2022, says smart meters "produce very low level fields that sometimes cannot be distinguished from the total background radiofrequency radiation levels inside a home."
What the reviewers concluded, and what they didn't settle
The CCST report, finished in April 2011 at the request of two state legislators, found that the FCC standard "provides an adequate factor of safety against known RF induced health impacts" of smart meters. It also found "no clear evidence that additional standards are needed."
The report also spells out what it didn't do. CCST ran no primary research of its own. It said non-thermal effects of long, low-level exposure "are not well understood" and that more research and monitoring is needed. It also said wired setups could be considered for customers who remain concerned about wireless meters.
Most of the duty-cycle numbers came from utility networks and their vendors. EPRI tested a single model, at the manufacturer's site, with the manufacturer's help. In May 2011, a month after the CCST report, the World Health Organization's cancer agency classified radiofrequency fields as possibly carcinogenic, Group 2B, based on glioma risk associated with wireless phone use. Its working group judged the evidence limited for wireless phone users and inadequate for occupational and environmental exposures. The press release doesn't mention smart meters.
If you want to check your own meter
- Ask your utility which meter and radio you have, and its rated transmit power. EPRI tested 250 mW end points, and PG&E listed 1 W for its 900 MHz radio.
- Ask whether your meter also acts as a relay or collector for others. EPRI says those cell relays run at 1 W and transmitted up to 1% of the time in its sample.
- If you use a consumer RF meter, remember that a reading during a burst is an instantaneous level, while the FCC limit is a 30-minute average.
- Measure at the spots where you actually spend time, such as the bed or the desk, not with the probe touching the meter glass.
- Take health questions to a doctor. Meter or billing complaints go to the utility first and then, if that fails, to your state utility commission.
Utilities and regulators answer questions about the meter, not about consumer products. If you have questions about stickers sold by EMFCALM, a sticker shop, contact EMFCALM directly. None of the documents on this page tested stickers or anything like them.
The number we keep coming back to is 875 seconds. That's how long PG&E's busiest one-in-a-thousand meters were on the air in a day in 2011, a little under 15 minutes. Even a rack of ten meters sending nonstop, measured 8 inches behind it, came to 0.6% of the federal limit.